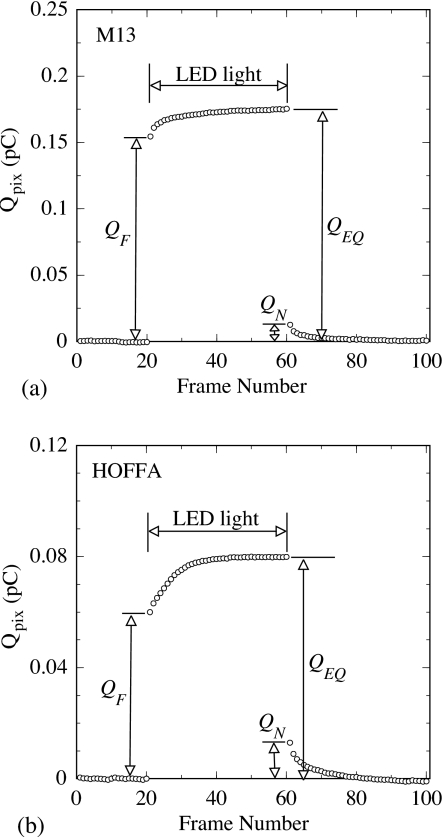
Figure 7.
Illustration of pixel data showing charge trapping and charge release. For (a) M13 and (b) HOFFA, pixel signal, Qpix, is plotted as a function of consecutive frame number for an acquisition sequence consisting of 20 dark frames, followed by 40 image frames (using a flashing LED), and a final 40 dark frames. For the sequences shown, Vbias was set to 2 V and the image frames were acquired at a pixel signal size of ∼6% of saturation. The labels QF, QN, and QEQ are related to pixel signal sizes used in the determination of Qtrap and Qrelease, as discussed in the text.

