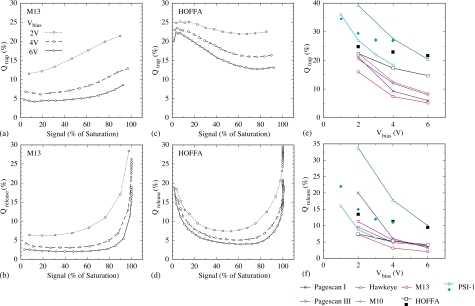
Figure 8.
Results for trapped charge, Qtrap, and released charge, Qrelease, at Vbias values ranging from 1 to 6 V. Qtrap is plotted as a function of pixel signal size for (a) M13 and (c) HOFFA. Qrelease is plotted as a function of signal size for (b) M13 and (d) HOFFA. The amount of (e) trapped charge and (f) released charge at 50% of pixel signal saturation are plotted as a function of Vbias for the arrays examined in this study (open symbols and crosses, with lines). In addition, the amount of trapped and released charge at 10% of saturation is also plotted for HOFFA and PSI-1 (closed symbols). Note that Qtrap results are not shown for signal sizes near saturation, due to limitations in the methodology (Refs. 18, 19). Further, note that the legend in (a) also applies to (b), (c), and (d), and the legend for (e) and (f) is shown below these graphs.

