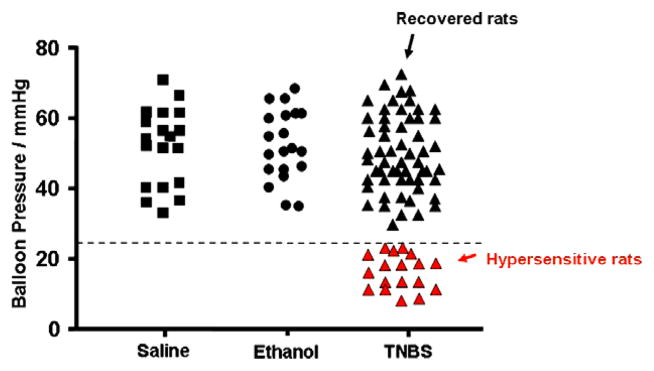
Fig. 1.
Colonic distension pressures that elicited the nociceptive threshold for each rat. The black squares represent saline controls and the black circles represent the ethanol-treated animals. The TNBS treated animals that recovered without any hypersensitivity are shown as black triangles and the hypersensitive rats are shown as red triangles. All values are means ± standard deviation (see Table 1). The dotted line on the y-axis = 25 mmHg.

