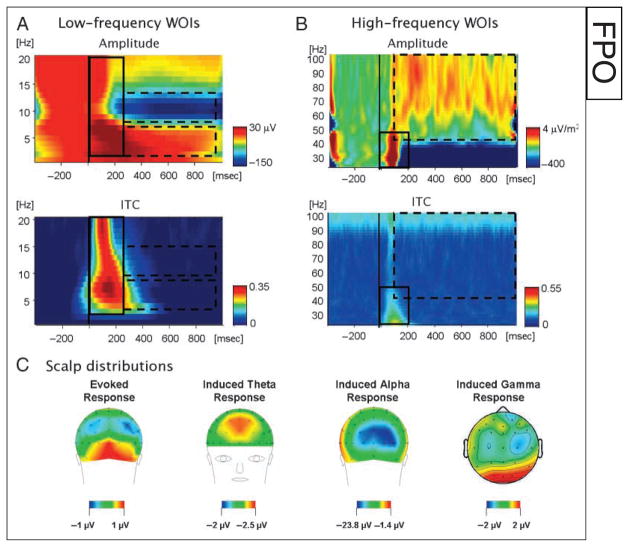
Figure 2.
Demonstration of the time–frequency WOIs chosen for statistic analysis in (A) the low-frequency range (1–20 Hz) and (B) the high-frequency range (20–100 Hz; based on CSD). WOIs were chosen based on the mean time–frequency plots of the amplitude (top) averaged across all experimental conditions. Hot colors indicate amplitudes higher than baseline, whereas cold colors indicate amplitudes lower than baseline (i.e., desynchronization). Each WOI was categorized as phase-locked or induced based on the mean ITC in the WOI (bottom). The phase-locked WOI is delineated by a solid rectangle, and the induced WOIs are delineated by a dashed rectangle. (C) Scalp distributions of the amplitudes in each WOI are depicted to illustrate where the maximal activity was found.

