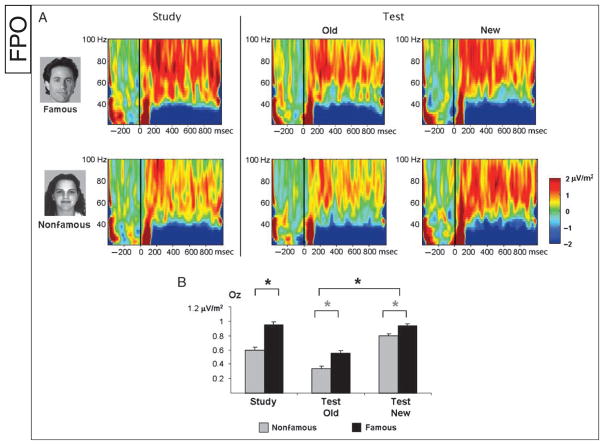
Figure 5.
(A) Time–frequency plots illustrating the amplitude of the CSD signal in the high-frequency range, between 20 and 100 Hz. (B) Mean induced gamma amplitude in the chosen WOI. During study, famous faces elicited higher gamma than nonfamous faces, and a similar trend was found during test (gray asterisks). In addition, during test, gamma amplitude decreased for old faces relative to new faces.

