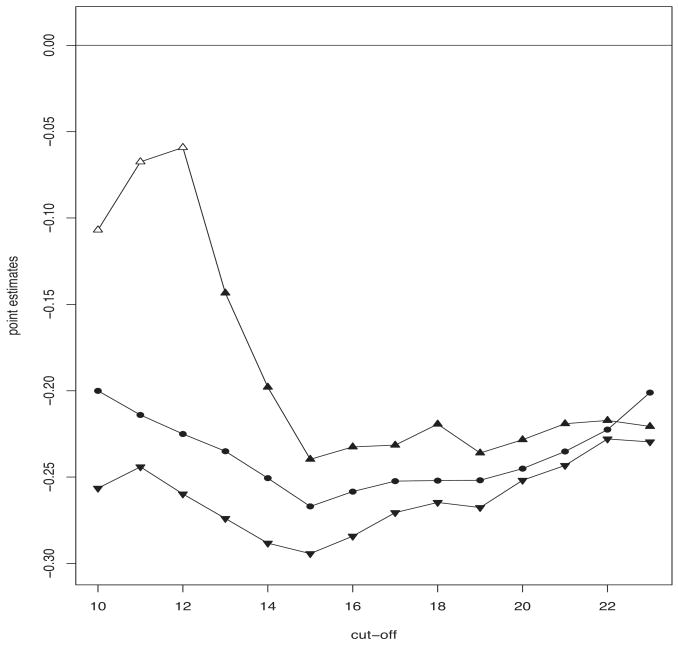
Figure 6.
CC (point-up triangles), MAI (point-down triangles) and LB (circles) estimates of the effect of being cognitively normal, as estimated by a battery of Cox models that include different definitions of the MMSE index, according to a sequence of cut-off points. Black (white) symbols indicate significant (not significant) estimates at a .95 confidence level.

