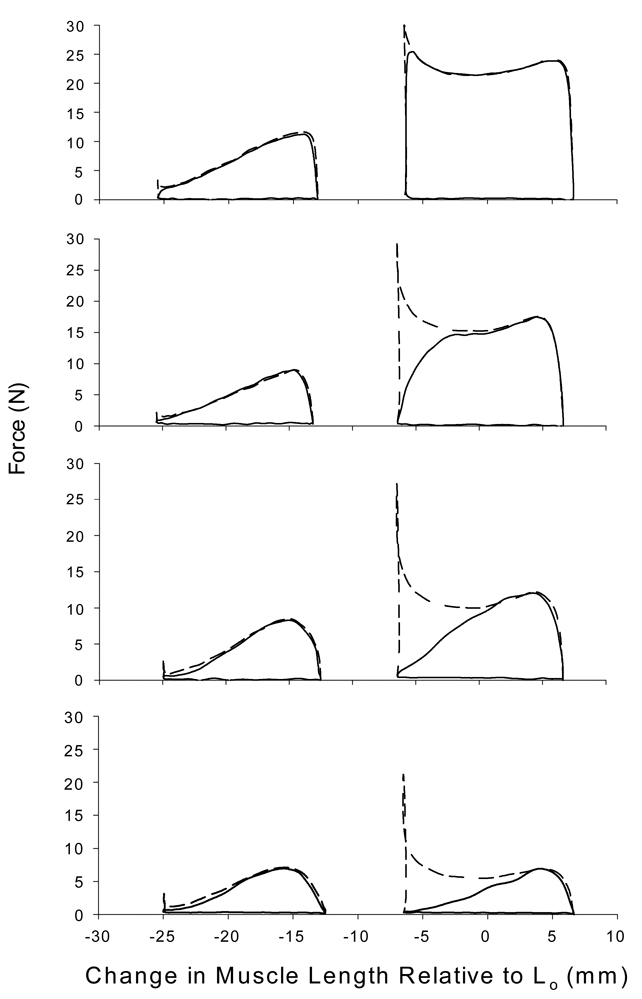
Figure 3.
Representative force-length trajectories from a single cat. Force-length trajectories in the left column represent walking gait excursion and those in the right column center about Lo (indicated by 0). The dashed line depicts force traces during discrete shortening contractions whereas the solid line depicts force traces during work loops.

