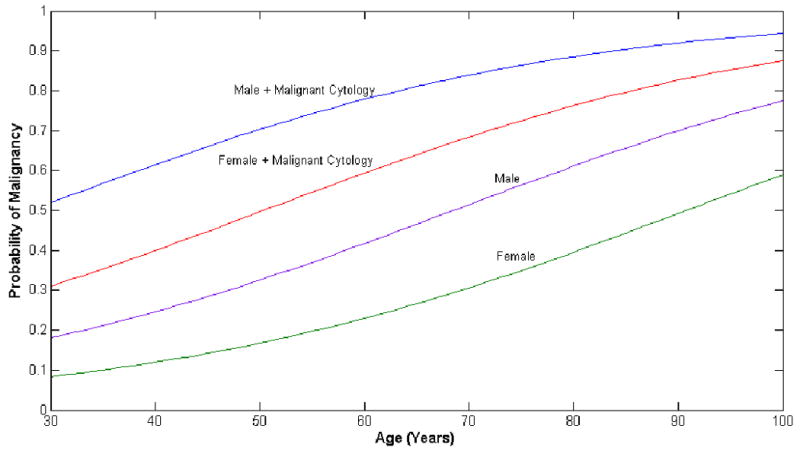
Figure 1.

Probability of Malignancy. Using the odds ratio from multivariate analysis (Table 4), the probability of malignancy is plotted against age of the patient. Each curve represents a different probability curve based on the gender and the presence of malignant cytology from EUS.
