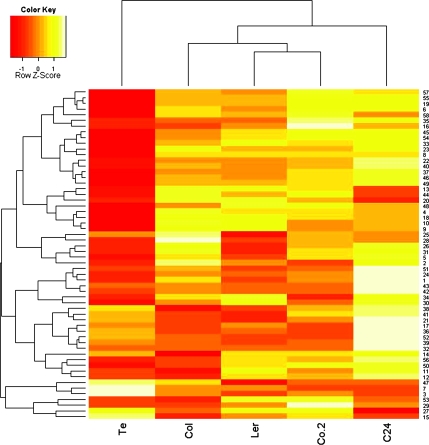
Figure 1.
Hierarchical Clustering of Changes in Metabolite Pool Sizes in the Five Parental Accessions during 14 d of Cold Acclimation at 4°C.
Relative signal intensities for each metabolite were normalized to the mean intensity over all samples and Euclidean distance was used for clustering. Red indicates the smallest and yellow the biggest differences in metabolite content between samples from non-acclimated and cold-acclimated plants. The color key indicates the Z-scores of the distributions of these differences, namely the magnitude and direction of variation from the mean for every metabolite. Metabolites are identified by the ID numbers listed in Supplemental Table 1.

