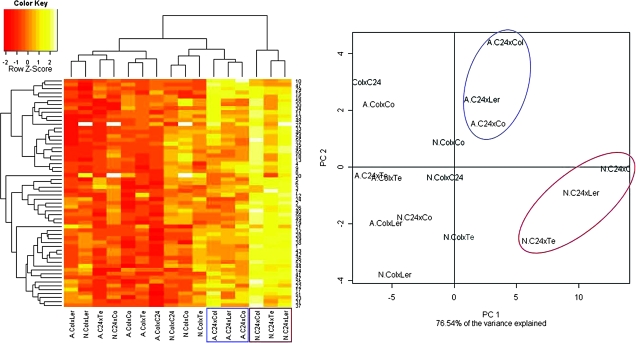
Figure 4.
Hierarchical Clustering and Principal Component Analysis (PCA) of the Mid-Parent Heterosis (MPH) in the Metabolite Content of Leaf Tissue from Eight F1 Populations Before (N) or After (A) 14 d of Cold Acclimation at 4°C.
Euclidian distance was used for clustering. Red indicates the smallest and yellow the largest MPH values. The color key indicates the Z-scores of the distributions of the MPH values in the metabolite pool sizes, namely the magnitude and direction of variation from the mean MPH for each metabolite. White indicates missing values. Metabolites are identified by the ID numbers listed in Supplemental Table 1. The PCA results are shown for the Principle Components (PC) 1 and 2, which together explain 76.5% of the total variance in the dataset. The two most extreme groups of non-acclimated and acclimated samples are highlighted in red and blue, respectively.

