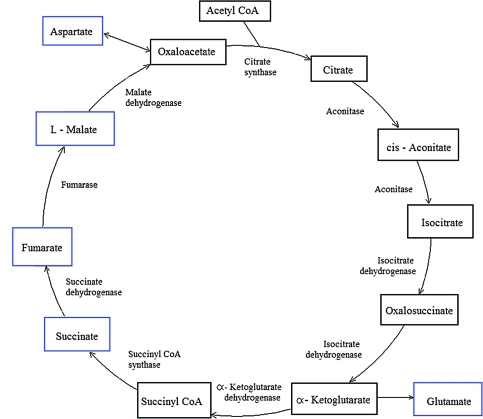
Figure 5.
Schematic Representation of the TCA Cycle.
Metabolite names are shown in the boxes and the names of the relevant enzymes inside the cycle. Metabolites boxed in blue were identified as contributing to the prediction of MPH in freezing tolerance (Table 2). Metabolites boxed in black were either not measured or were not selected in the prediction model for heterosis in freezing tolerance (cis-aconitate and isocitrate).

