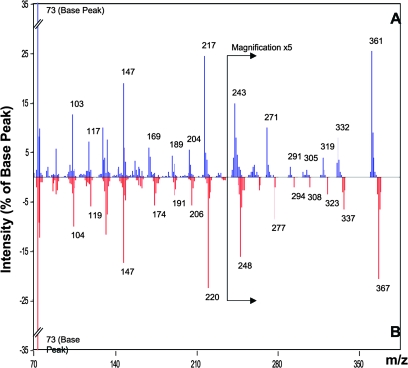
Figure 6.
Mass Spectral Tag (MST) Information of Analyte A196004 as Archived in the Golm Metabolome Database (GMD).
A196004 is represented in GMD by ambient mass spectra (A). In addition, a 13C-enriched variant (B) was obtained after 13CO2 in vivo labeling of Arabidopsis thaliana plants as described recently (Huege et al., 2007). The 13C-enriched variant proves metabolic origin of this MST and supports spectral interpretation by indicating the number of carbon atoms in each major mass fragment. Fragments that contain carbon atoms originating from the metabolite structure exhibit a respective mass shift; for example, the fragment at m/z 361 was shifted to 367 and thus contains six carbon atoms. Mass spectra were normalized to the base peak and are visualized by percent of base peak intensity.

