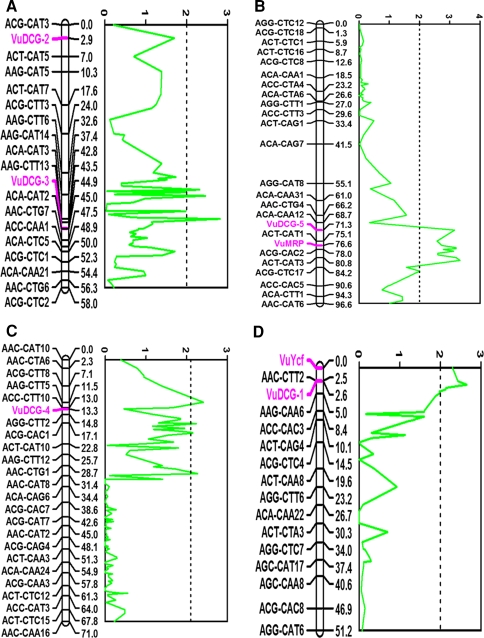
Fig. 1.
Map positions of restriction site polymorphism markers (bold and magenta) co-locating with drought-induced premature senescence QTLs highlighted by LOD traces (solid green lines) generated from multiple-QTL model mapping analysis. a linkage group 1, b linkage group 2, c linkage group 3, and d linkage group 5 of Muchero et al. (2009). Vertical broken lines represent LOD thresholds calculated at the 0.05 significance level

