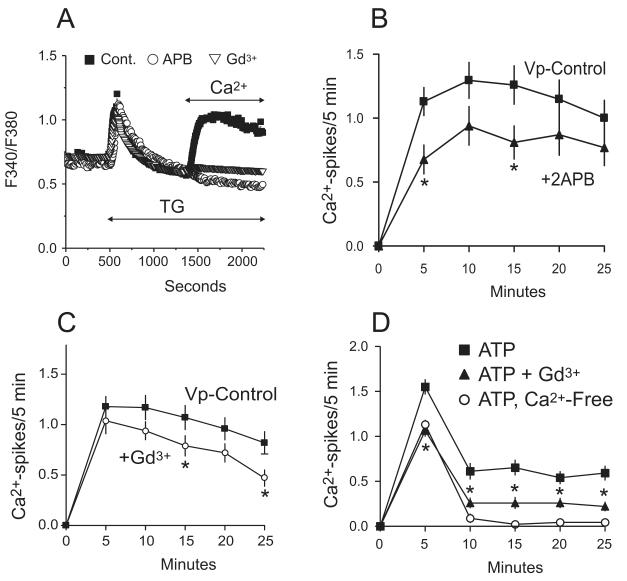
Figure 2. Effect of SOCE inhibitors on thapsigargin (TG) induced entry and agonist-induced Ca2+ oscillations.
A) Shown is a trace of 30-35 hepatocytes, representative of 3 experiments, under control conditions (filled squares) or pre-treated with either 30 μM 2APB (open circles) or 1 μM Gd3+ (open triangles) before adding thapsigargin in the absence of Ca2+ followed by addition of 1.8 mM Ca2+. Treatment with 2APB or Gd3+ completely blocks the Ca2+ entry. B-C) The frequency of vasopressin-induced oscillations is diminished by 2APB or Gd3+. The data is taken from 3 independent experiments and is reported as the mean ± SEM, where N=54 and 50 cells for 2APB or Gd3+, respectively. One-Way ANOVA revealed which time points had a significant change in the number of Ca2+ spikes, denoted by “*” (p < 0.05).
D) ATP-induced oscillations in Ca2+ free media or 1 μM Gd3+ follow trends similar to that observed when using vasopressin. The data, taken from 3 independent experiments, is reported as the mean ± SEM where N=98, 82, and 60 for 5 μM ATP, 1 μM Gd3+, or nominally-free Ca2+, respectively. One-Way Anova revealed a significant change in the number of Ca2+ spikes for each time point, denoted by “*” (p < 0.0001).

