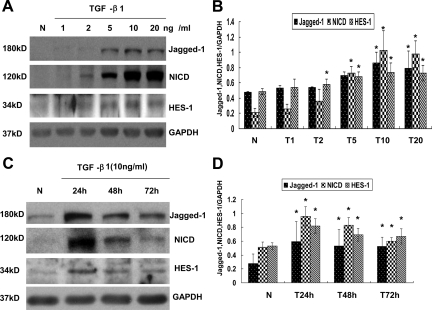
Figure 8.
TGF-β1 induced Notch signaling cascade expression in RPMCs in a dose- and time-dependent manner. A: RPMCs were treated with the indicated amount of TGF-β1 for 48 hours, and cell lysates were harvested for Western blot analysis with antibodies against NICD, Jagged-1, and HES-1. The membrane was then stripped and blotted with anti-GAPDH to verify equal protein loading. B: Graphic representation of relative abundance of NICD, Jagged-1, and HES-1 normalized to GAPDH. Data are given as mean ± SD values of three independent experiments. *P < 0.05 versus normal cells. C: TGF-β1 induced Notch signaling cascade expression in RPMCs in a time dependent manner. RPMCs were treated with 10 ng/ml of TGF-β1 for the indicated time period, and cell lysates were harvested for Western blot analysis with antibody against NICD, Jagged-1, and HES-1. The membrane was then stripped and blotted with anti-GAPDH to verify equivalent protein loading. D: Graphic representation of the relative abundance of NICD, Jagged-1, and HES-1 normalized to GAPDH. Data are given as mean ± SD values of three independent experiments. *P < 0.05 versus normal cells.

