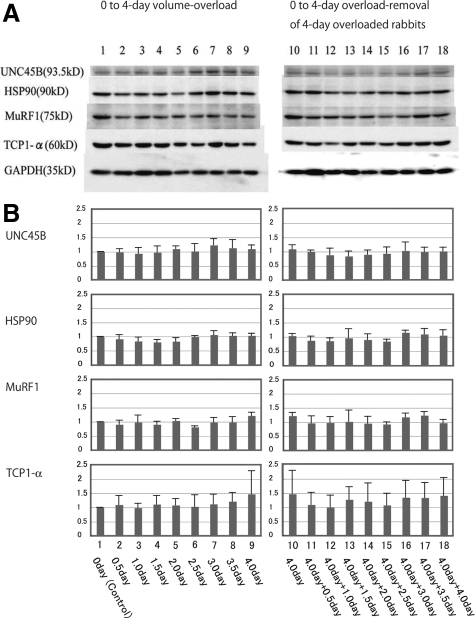
Figure 17.
Western blot of chaperons (TCP-1α, HSP90 and UNC45B) and ubiquitin ligase (MuRF1) in volume-overloaded hearts and overload-removed hearts. Left panel shows overload experiments; Lane 1: Control (0-day), Lane 2: 0.5-day AVF, Lane 3: 1-day AVF, Lane 4: 1.5-day AVF, Lane 5: 2-day AVF, Lane 6: 2.5-day AVF, Lane 7: 3-day AVF, Lane 8: 3.5-day AVF, Lane 9: 4-day AVF. Right panel shows overload-removal experiments of 4-day overloaded rabbits; Lane 10: 4-day AVF, Lane 11: 4-day AVF plus 0.5-day AVF closure, Lane 12: 4-day AVF plus 1-day AVF closure, Lane 13: 4-day AVF plus 1.5-day AVF closure, Lane 14: 4-day AVF plus 2-day AVF closure, Lane 15: 4-day AVF plus 2.5-day AVF closure, Lane 16: 4-day AVF plus 3-day AVF closure, Lane 17: 4-day AVF plus 3.5-day AVF closure, Lane 18: 4-day AVF plus 4-day AVF closure. Upper panel (A) shows one representative Western blot of three chaperons (UNC45B, HSP90, and TCP1-α) and one ubiquitin ligase (MuRF1). Lower panel (B) shows graphs of ratio to control of these proteins. Error bar indicates mean ± SEM. Three chaperons and ubiquitin ligase shows no significant difference among overload experiments. They show no significant difference among overload removal experiments. They show no significant difference between the group of overload experiments and that of overload removal experiments.

