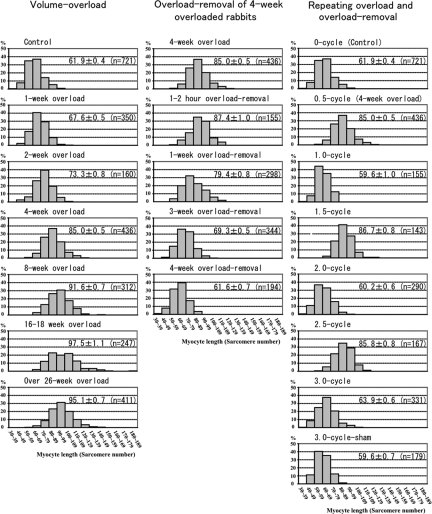
Figure 7.
Histogram of myocyte length. The left column is histograms of volume overload experiments. Histograms shift to the right gradually until 4 weeks. The myocyte length (ML) at 4 weeks is significant longer than that of 2 weeks (P < 0.0001), which is significantly longer than that of control (P < 0.0001). At 8 weeks, ML is significantly longer than that of 4 weeks and some long myocytes reach 140 sarcomeres. At 16 to 18 weeks and over 26 weeks, the ML is significantly longer than that of 8 weeks (P < 0.0001) and very long myocytes reach 180 sarcomeres. The middle column is histograms of overload-removal experiments of 4-week overloaded animals. Histograms shift to the left gradually until 4-week overload removal. The ML of 4-week overload removal is significantly shorter than that of 3-week overload removal (P < 0.0001), which is significantly shorter than that of 1-week overload removal (P < 0.0001). ML of 1-week overload removal is significantly shorter than that of 1- to 2-hour overload removal (P < 0.0001) or that of 4-week overloaded animals (P < 0.0001). The right column is histograms of repeating overload and overload-removal. Histograms of 1.0-cycle, 2.0-cycle and 3.0-cycle are similar to histogram of control, while those of 1.5-cycle and 2.5-cycle are similar to histogram of 4-week overload (0.5-cycle). ML of 1.5-cycle and 2.5-cycle are significantly longer than those of 1.0-cycle, 2.0-cycle, 3.0-cycle and 3-cycle sham, respectively (P < 0.0001). ML is expressed mean ± SEM in each histogram. (n) is number of measured myocytes. X bar indicates sarcomere number in 10-sarcomere steps and Y bar indicates % of myocytes.

