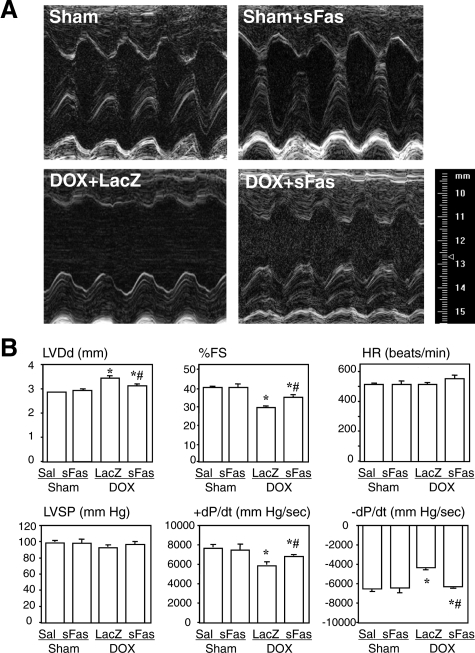
Figure 1.
Effects of sFas gene delivery on LV geometry and function evaluated with echocardiography and cardiac catheterization 2 weeks after doxorubicin injection. A: Representative M-mode echocardiograms at the level of the ventricles in each group. B: Comparison of hemodynamic parameters among the groups. LVDd, left ventricular end-diastolic dimension; %FS, %fractional shortening; LVSP, left ventricular peak systolic pressure. Sal, saline treatment; sFas, sFas gene transfer; LacZ, LacZ gene transfer; DOX, doxorubicin treatment. *P < 0.05 versus the saline-treated sham group; #P < 0.05 versus the doxorubicin-treated group with LacZ gene transfer.

