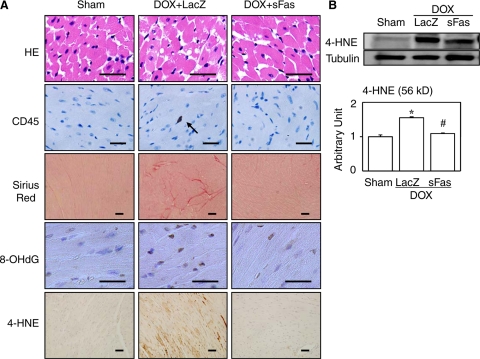
Figure 2.
Effects of sFas gene delivery on cardiac histology and protein expression evaluated 2 weeks after doxorubicin injection. A: Representative photomicrographs are shown for each group. HE, hematoxylin-eosin staining; CD45, immunohistochemical staining for CD45; Sirius Red, Sirius red staining; 8-OHdG, immunohistochemical staining for 8-OHdG; 4-HNE, immunohistochemical staining for 4-HNE. The arrow in CD45 points to the immunopositive cell. Scale bars = 20 μm. B: Western blot for 4-HNE with its densitometric analysis. *P < 0.05 versus the sham group; #P < 0.05 versus the doxorubicin-treated group with LacZ gene transfer.

