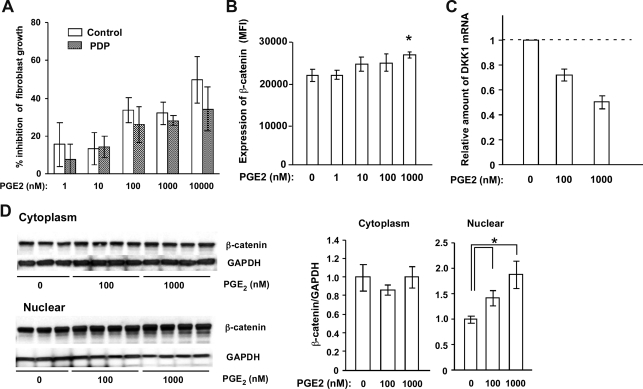
Figure 4.
Effect of PGE2 on fibroblasts. A: The % inhibition of the number of fibroblasts from a healthy donor and a PDP patient by the addition of PGE2 was evaluated as (Number of fibroblasts without PGE2 − Number of fibroblasts with PGE2)/Number of fibroblasts without PGE2 × 100. The growth inhibitory effect of PGE2 is dose-dependent and comparable between these two groups. The values are expressed as the mean ± SD (n = 3) and are representative of two independent experiments. B, C: The effects of PGE2 on β-catenin expression and DKK1 mRNA levels in fibroblasts were evaluated. The mean fluorescent intensity (MFI) of β-catenin (B) and DKK1 mRNA (C) in fibroblasts after exposure to PGE2 is shown. The amount of DKK1 mRNA relative to GAPDH mRNA without the addition of PGE2 is regarded as one. The values are expressed as the mean ± SD (n = 3) and *P < 0.05. D: Cytoplasm- (right panel) and nuclear- (left panel) protein samples from fibroblasts treated with or without 0, 100, and 1000 nmol/L PGE2 for 4 days were used to determine the effect of PGE2 on β-catenin expression. The values are expressed as the mean ± SD (n = 3 to 4) and *P < 0.05.

