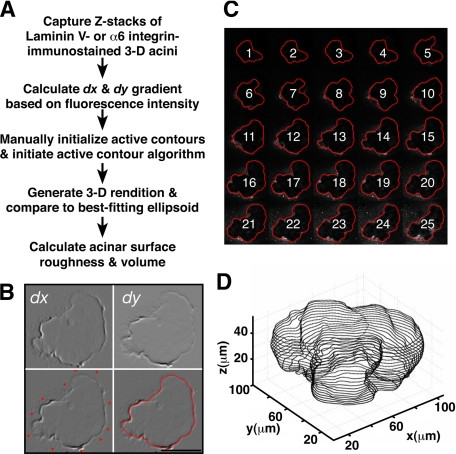
Figure 2.
Reconstructing 3-D mammary epithelial tissue architecture. A: Schema delineating the computational steps used to measure acinar surface roughness and volume. B: In this example, the equatorial 2-D confocal slice from a laminin-V immunostained acinus, treated previously with TN-C for 8 days, was subjected to dx and dy pre-processing based on fluorescence intensity (top). Active contours were manually initiated by selecting multiple points close to the edge of the acinus (lower left). After active contour fitting, a final trace of the edge was obtained automatically (lower right). C: The trace obtained in B was extrapolated to all subsequent remaining 2-D slices of the acinus resulting in the automated generation of a montage of traces. D: Montages described in C were used to render a 3-D projection.

