Figure 3.
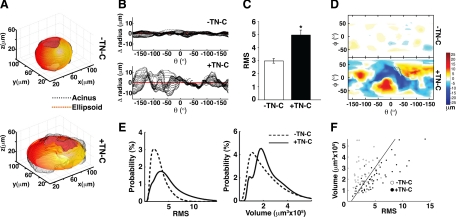
TN-C increases surface roughness, but not acinar volume. A: Examples of 3-D renditions of individual acini (black) generated in the absence (top) or presence (bottom) of TN-C in 8 day cultures. A customized ellipsoid (red-yellow) was designed and fitted to each individual acinus. B: Change in radius for each acinar slice (black) denotes distance away from the perfect ellipsoid for the acini depicted in A; the red horizontal line at ‘0′ represents the perfect ellipsoid. In the absence of TN-C (top), each slice did not deviate more than a few μms from the perfect ellipsoid, whereas in the presence of TN-C (bottom), deviations exceeded 10 μm. C: 3-D acinar structure was quantified by measuring root mean square (RMS; absolute difference from perfect ellipsoid) values for acini cultured for 8 days in the absence or presence of TN-C. TN-C evoked a 1.7-fold increase in RMS (−TN-C = 2.98 ± 0.18, +TN-C = 4.96 ± 0.38, n = 103; P = 0.024). D: Mercator projections of 3-D acini: protrusions are displayed in yellow and red while indentations appear blue. E: Distribution of RMS values (left) and volumes (right) for acini generated in the absence (dashed line) or presence (solid line) of TN-C for 8 days. (F) Plotting RMS versus volume yields 2 distinct groups of acini with the line showing the best linear classification using logistic regression at a performance of 79.5%.

