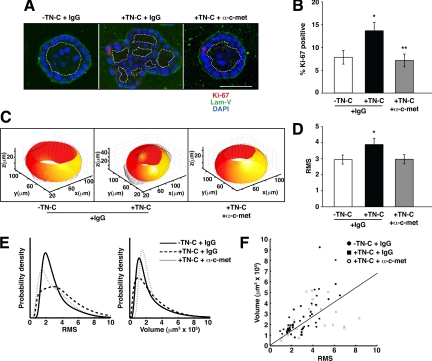
Figure 5.
Blocking c-met function reverses the TN-C–dependent phenotype. A: Representative confocal immunofluorescence photomicrographs showing reversion of the TN-C–induced phenotype on introduction of a function-blocking c-met antibody. B: C-met blockade significantly decreases the proliferation of MCF-10A acini treated with TN-C (−TN-C + IgG, 7.82 ± 1.49; +TN-C + IgG, 13.65 ± 1.82; +TN-C + α-c-met, 7.12 ± 1.41; n = 60; *P = 0.017; **P = 0.0079). C: Examples of 3-D renditions of individual acini (black), generated in the absence of TN-C (left), presence of TN-C (middle), and presence of TN-C and c-met blocking antibody (right), along with customized ellipsoids (red-yellow). D: C-met blockade restores normal acinar architecture as measured by RMS (−TN-C + IgG, 2.95 ± 0.28; +TN-C + IgG, 3.89 ± 0.39; +TN-C + α-c-met, 2.97 ± 0.29; n = 74; *P = 0.036). E: Distribution of RMS values (left) and volumes (right) for acini generated in the absence of TN-C (solid line), presence of TN-C (horizontally dashed line), and in the presence of TN-C and c-met blocking antibody (vertically dashed line) for 8 days. F: Plotting volume versus RMS results in clustering of the 3 groups of acini into 2 distinct populations, (ie, the absence of TN-C and presence of TN-C and c-met blocking antibody form one cluster, whereas the presence of TN-C and IgG form a different cluster), with the line showing the best linear classification using logistic regression at a performance of 72%.

