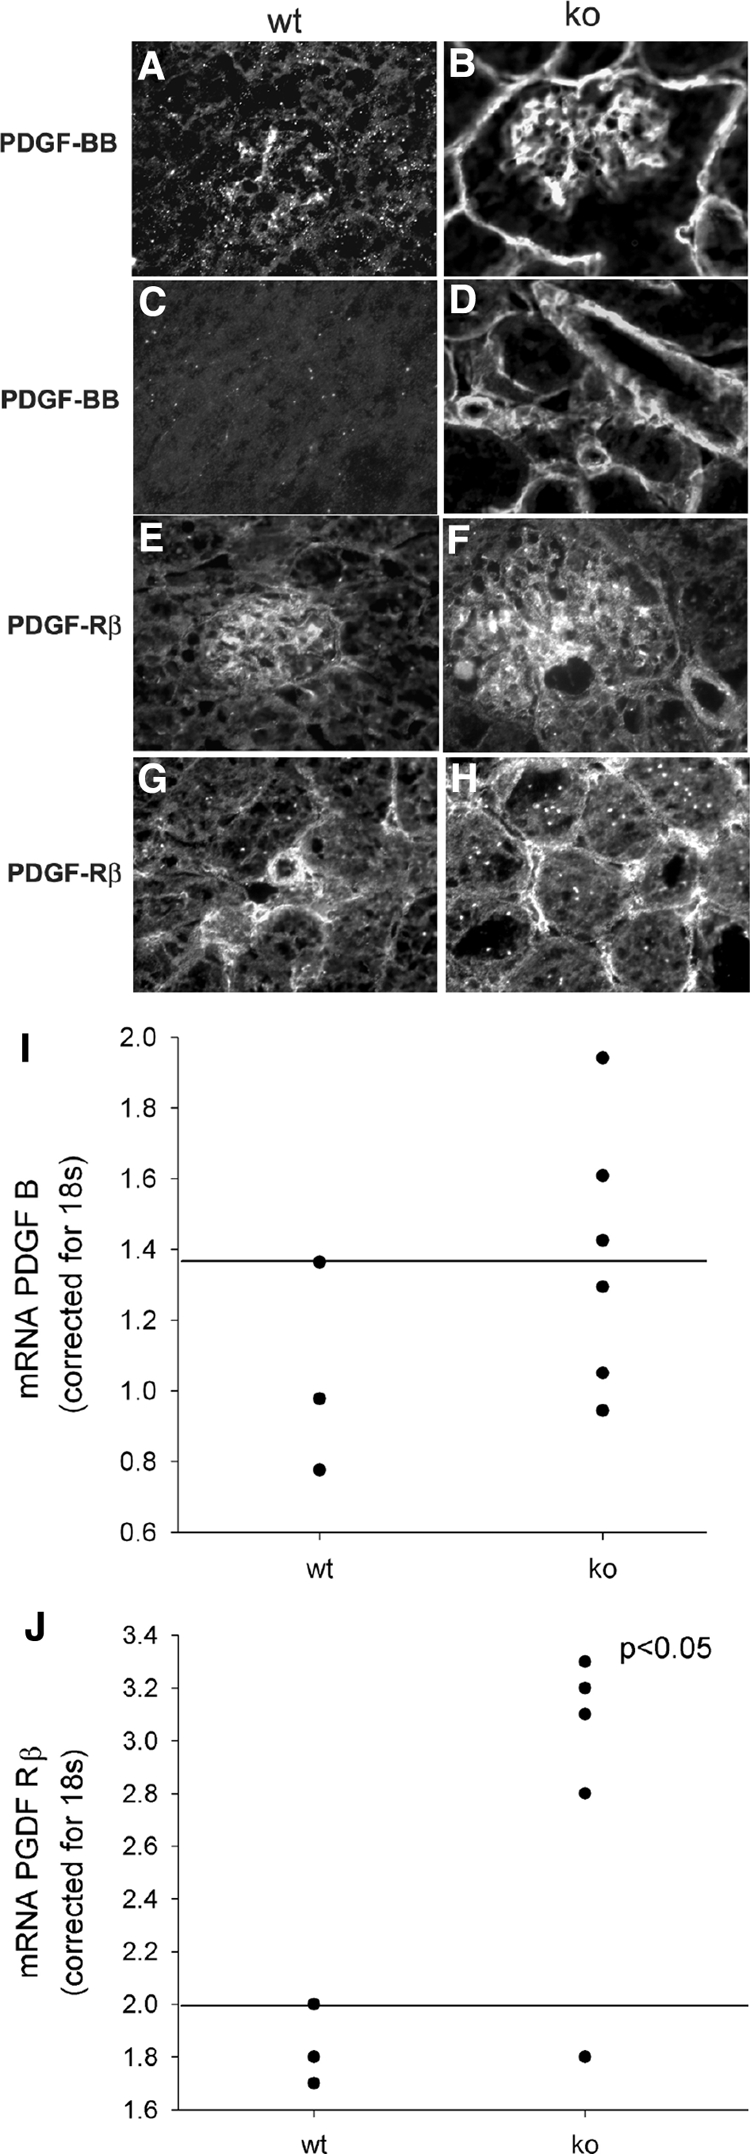
Figure 7.

PDGF and PDGF-Rβ. Staining for PDGF-BB (A–D) and PDGF-Rβ (E–H) are shown in wt (A, C, E, G) and ko (B, D, F, H) mice. Note increased staining for both PDGF and PDGF-Rβ in lama4 mice. qPCR for PDGF-B mRNA (I) and PDGF-Rβ mRNA (J). mRNA in whole kidney cortex was determined by qPCR and corrected for 18S RNA. The line represents the upper value detected in normal mice. Note that mRNA for PDGF-Rβ was significantly increased (P < 0.05) in ko mice.
