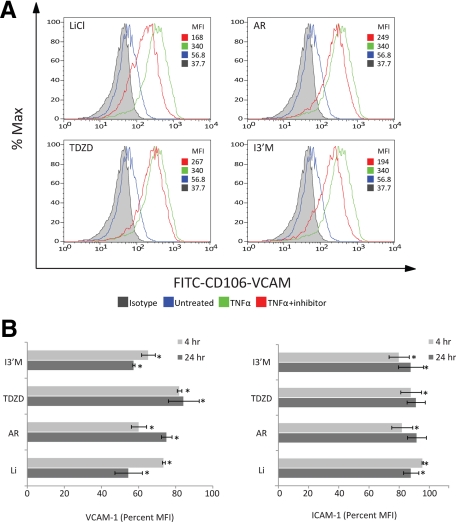
Figure 5.
GSK3β inhibitors diminish expression of adhesion molecules in cytokine-activated BMVECs. Adhesion molecule expression was measured in BMVECs stimulated with TNFα (20 ng/ml). Panel A shows representative histograms of FACS analysis for surface expression of vascular cell adhesion molecule-1 (VCAM-1) at 24 hours in untreated, TNFα-treated, and TNFα-treated BMVECs in combination with the indicated GSK3β inhibitors. The data are represented as the mean fluorescence intensity of VCAM-1 as a percentage of the maximum intensity. Panel B shows the accumulative data for surface expression of VCAM-1 (left graph) and ICAM-1 (right graph), comparing 4 hours with 24 hours. The data shown are the average median fluorescence intensity of the experimental (inhibitor plus TNFα) divided by the TNFα only condition; the results are from at least three independent experiments. *P < 0.05.

