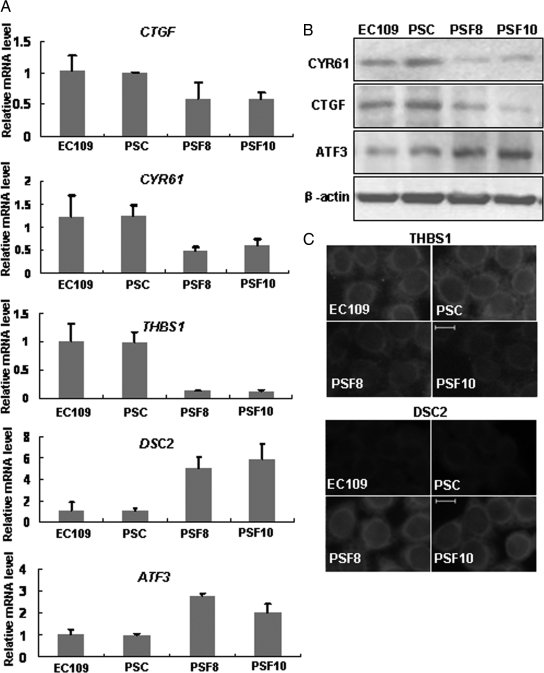
Figure 4-8375.
Real-time RT-PCR, Western blotting, and immunofluorescence analysis validate the microarray data. A: Real-time RT-PCR analysis was performed to analyze the expression levels of five genes: CTGF, CYR61, THBS1, ATF3, and DSC2. The expression levels were normalized by the level of GAPDH and represented as fold change over PSC cells. B: Western blot analysis was performed to determine the protein levels of CTGF, CYR61, and ATF3. C: Immunofluorescence analysis was performed to compare THBS1 and DSC2 expression. Representative images show localization of THBS1 and DSC2. Scale bar, 10 μm. EC109 is a human ESCC cell line that expresses high levels of fascin (control). PSC is an EC109 cell line transfected with nonspecific siRNA (control). PSF8 and PSF10 are two different PSC-based fascin-depleted cell lines prepared using RNAi method.

