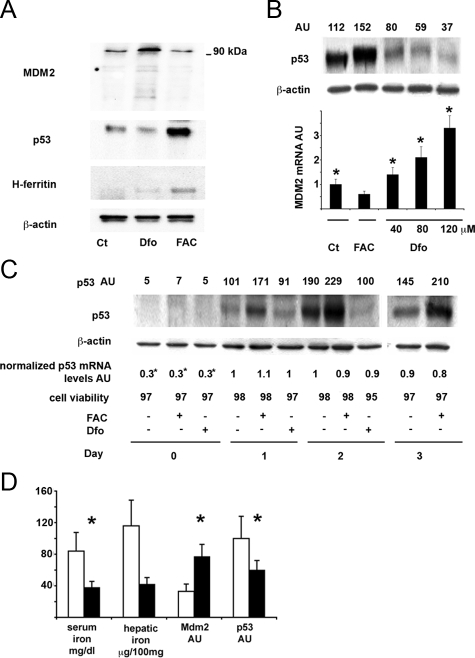
Figure 2.
Effect of iron status on the MDM2/p53 pathway in SV40 mouse hepatocytes and in rat liver. A: Effect of Dfo and FAC on MDM2 and p53 protein levels in SV40 hepatocytes. Twenty-four hours after plating, cells were treated with 100 μmol/L Dfo (Dfo) or 150 μmol/L FAC (FAC) or vehicle for 24 hours and then lysed. MDM2, p53, and H-ferritin were detected in cell extracts by immunoblot analysis. The blots were reprobed with the antibody against β-actin as a loading control. B: Dose response relationship between iron availability and p53 protein levels in SV40 hepatocytes. Ct: control, untreated hepatocytes. Cells were treated for 24 hours with the indicated concentrations of FAC and Dfo. The upper part of the figure indicates the p53/β-actin ratio as detected by densitometry. AU: arbitrary units. Results are representative of two independent experiments. In the lower part of the figure the corresponding β-actin normalized MDM2 mRNA levels are shown. Results are representative of two independent experiments. *P < 0.05 vs. untreated cells. C: Effect of iron status on p53 protein and mRNA levels and cell viability in differentiating SV40 hepatocytes, at different days from cell plating. AU: arbitrary units. p53 AU indicates the p53/β-actin ratio as detected by densitometry. p53 mRNA levels were normalized for β-actin. *P < 0.05 vs. untreated cells 24 hours after plating (controls). Results are representative of two independent experiments. D: Effect of iron depletion by Dfo on serum iron, hepatic iron concentration, MDM2 and p53 protein levels in rat liver. White bars: control rats (n = 5), black bars: iron depleted rats (n = 4). Serum iron and hepatic iron concentration were measured by atomic absorption spectrometry. Protein expression of p53 and MDM2, was evaluated by densitometry and normalized for β-actin. AU: arbitrary units. *P ≤ 0.05 vs. control rats.

