
Figure 6.
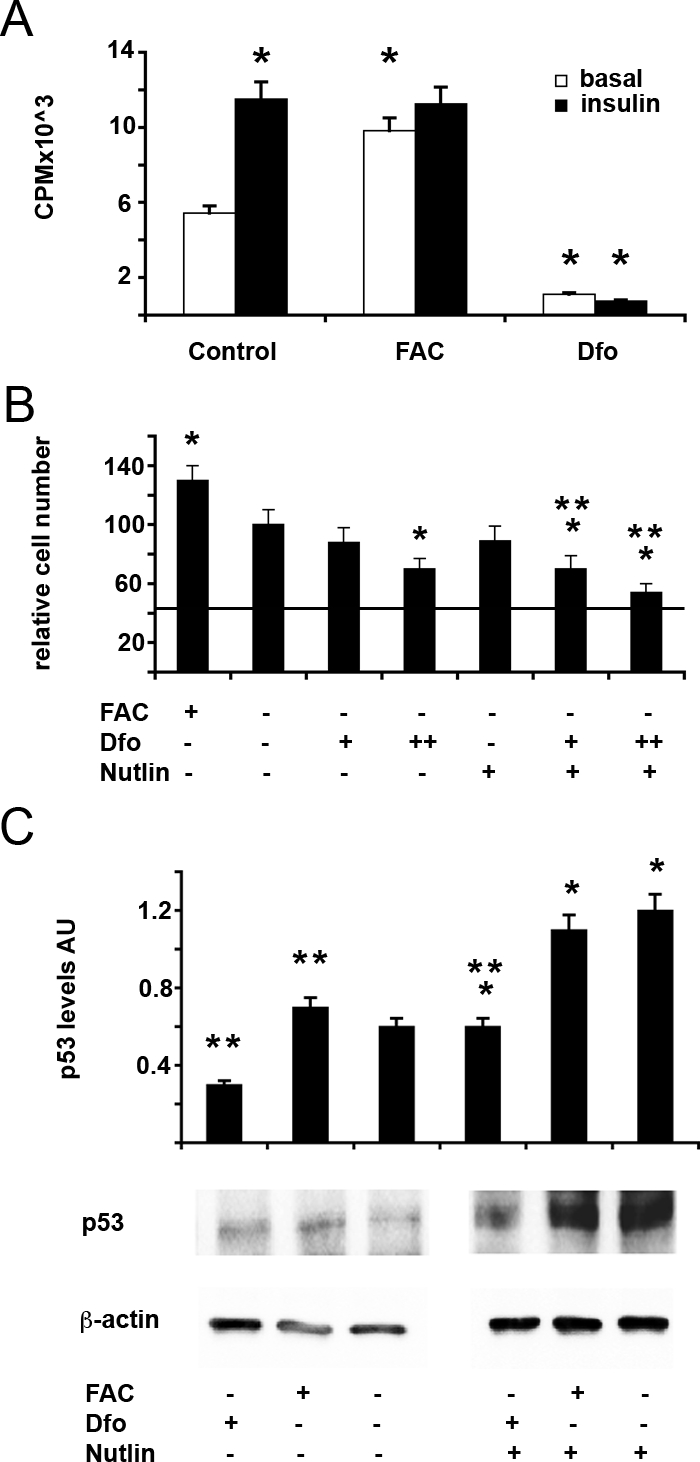
Effect of iron status and of modulation of MDM2/p53 on cell proliferation in HepG2 human hepatoblastoma cells. A: Effect of iron status on H3-Thymidine incorporation in HepG2 cells untreated (Control) and treated for 24 hours with 150 μmol/L FAC (FAC) or 100 μmol/L Dfo (Dfo) in the presence or absence of insulin 0.33 μmol/L. Results are mean ± SD of three independent experiments. cpm: counts per minute. *P < 0.05 vs. untreated cells in the absence of insulin. B: Effect of iron status and of MDM2/p53 modulation on cell number in HepG2 cells untreated or treated for 24 hours with 150 μmol/L FAC (FAC) or 80/120 μmol/L Dfo (+/++ Dfo) in the presence or absence of 25 μmol/L nutlin (Nutlin). The horizontal line indicated the number of cells plated at the beginning of the experiment. *P < 0.05 vs. untreated cells in the absence of nutlin, **P < 0.05 vs. untreated cells in the presence of nutlin. C: Effect of iron status and of MDM2/p53 modulation on p53 protein levels in HepG2 cells untreated or treated for 24 hours with 150 μmol/L FAC (FAC) or 120 μmol/L Dfo (Dfo) in the presence or absence of 25 μmol/L nutlin (Nutlin). AU: protein levels normalized for β-actin, arbitrary units. Results are representative of two independent experiments. *P < 0.05 vs. untreated cells in the absence of nutlin, **P < 0.05 vs. untreated cells in the presence of nutlin.