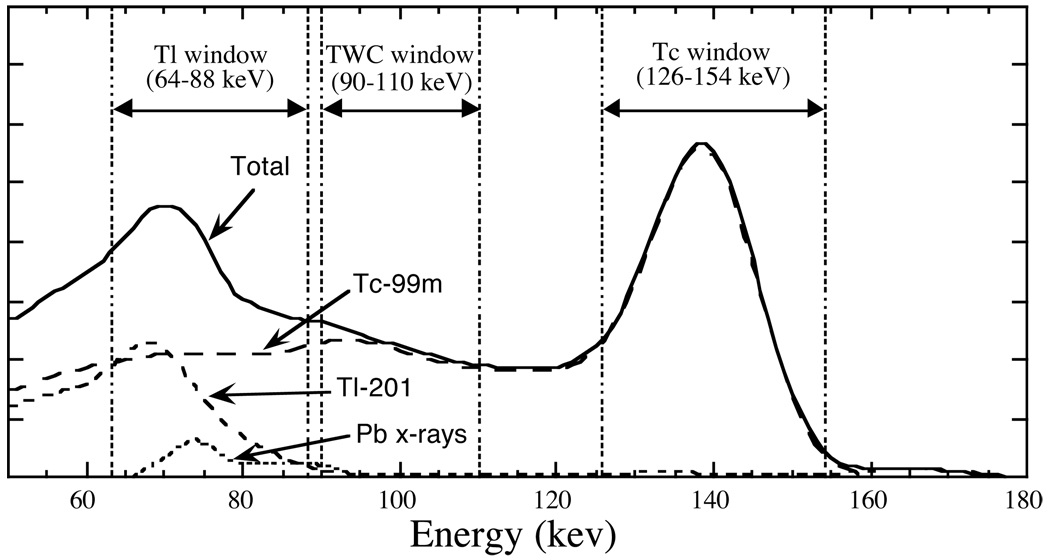
Figure 1.
Sample dual-isotope energy spectrum indicating the components due to Tc-99m, Tl-201, and lead fluorescence x-rays (from Tc-99m photons interacting with the collimator). Photopeak energy windows for Tc and Tl are indicated, and the third energy window used by the TWC compensation method is also shown.

