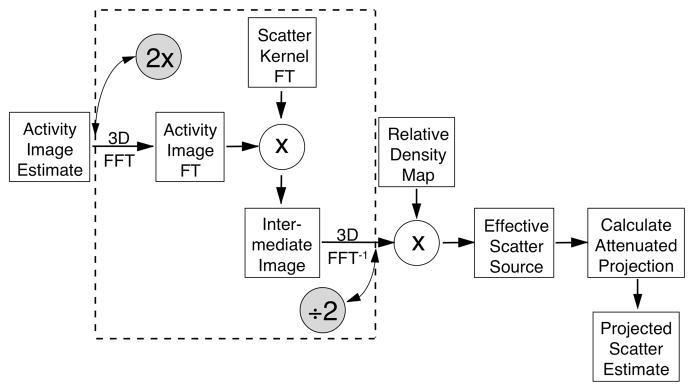
Figure 1.
Diagram indicating the basic steps of the ESSE scatter model. The model inputs the activity image estimate, the relative density map and the ESSE scatter kernel, and outputs the projected scatter estimate. When Coarse-Grid Scatter Modeling is incorporated into the ESSE model, the operations within the dashed-line box are performed using a larger voxel size than the other operations. The shaded circles indicate where the coarse-grid collapse and expansions are performed.

