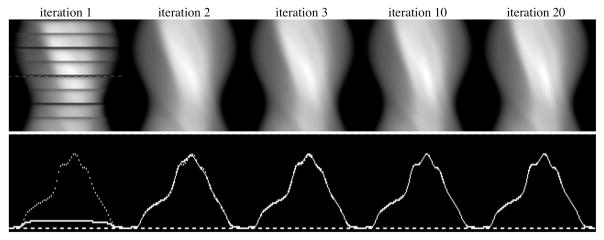
Figure 2.
Scatter estimate sinograms (top row) and profiles across the angle indicated (bottom row) as projected during OSEM iterations 1, 2, 3, 10 and 20. The profiles for each iteration were drawn with a solid line, and the profile for the “converged” scatter estimate at iteration 20 was overdrawn on each using a dotted line. The images demonstrate the rapid convergence of the scatter estimate with iteration. The dark bands appearing on the sinogram for iteration 1 are explained in the text.

