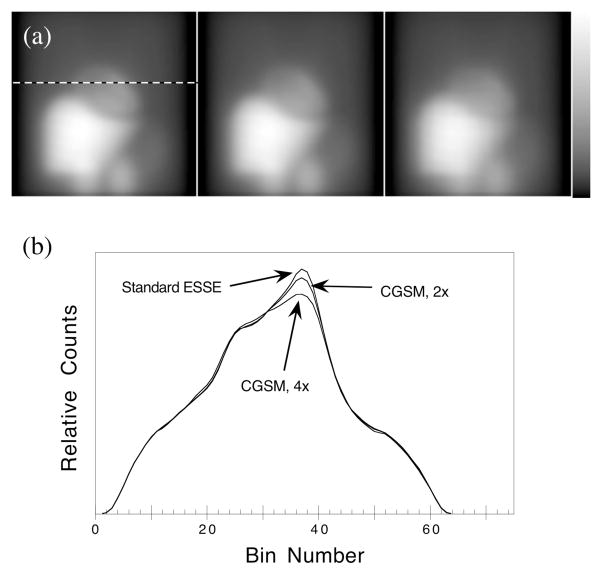
Figure 3.
Projected scatter estimates for a single view of the MCAT phantom (a) and horizontal profiles(b). The scatter estimates were projected using the standard ESSE scatter model (left), and using CGSM with collapse factors of 2 (center) and 4 (right). The profiles were drawn at the position indicated by the dashed line.

