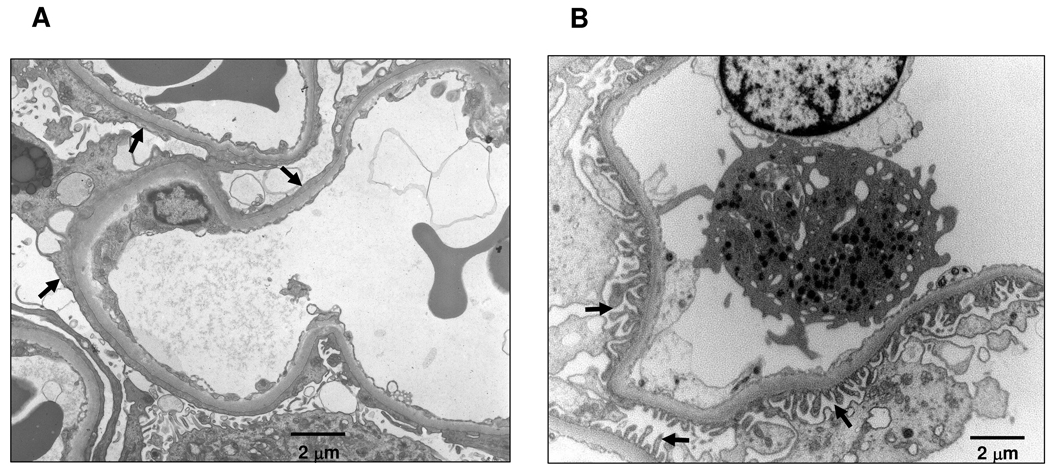
Figure 2.
Electron micrographs of glomerular capillary loops. (A) Glomerulus from a patient with nephrotic-range proteinuria. Black arrows indicate areas of effacement of the foot processes of the epithelial podocyte. Effacement is associated with a substantial decrease in the number of slit diaphragms. (B) Normal glomerulus. Black arrows indicate intact foot processes of the epithelial podocyte overlying the glomerular basement membrane. Slit diaphragms are located between the foot processes. Bars indicate 2 micrometers.

