
Figure 2.
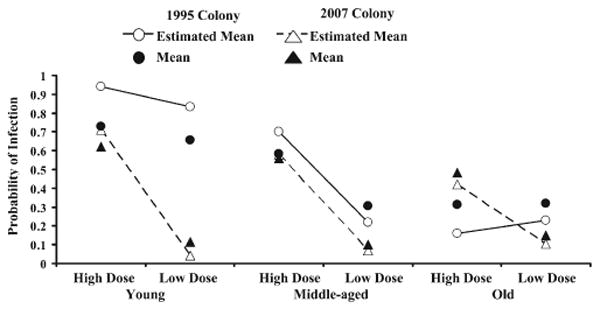
Logit estimates from generalized linear mixed model showing the relationship between the occurrence of body and leg infection between different ages, doses, and colonies (age × dose × colony; F = 3.83, degrees of freedom = 2, 3367, P = 0.022). The probability of infection and the estimated mean probability of infection are plotted for different colonies (circle = 1995 colony; triangle = 2007 colony). Colonies show different infection responses caused by age and dose. Means and estimated means are as in Figure 1.