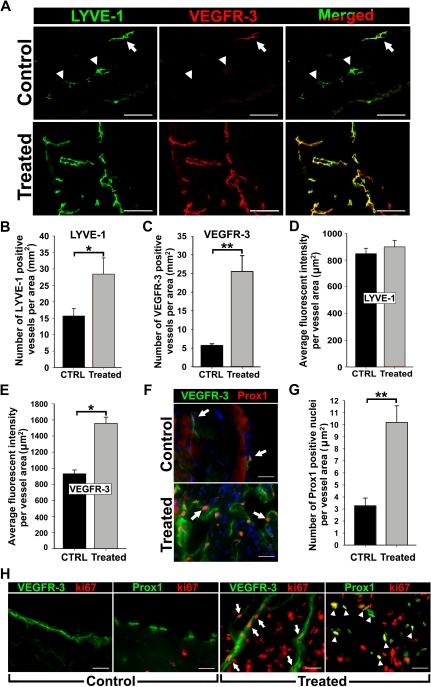
Figure 1.
Inflammation induces VEGFR-3 and Prox1 expression in activated lymphatic vessels. Peritonitis was induced by repetitive intraperitoneal injections of thioglycollate (TG) every 48 hours for 2 weeks. (A) Diaphragms from mice treated for 2 weeks with TG to induce peritonitis or saline as a control (n = 3 mice per group) were double-stained with anti–LYVE-1 and anti–VEGFR-3 antibodies. Note strong expression and complete overlap of VEGFR-3 with LYVE-1 in inflamed tissues compared with quiescent lymphatic vessels in control sections with weakly detected (arrow) or absent (arrowheads) VEGFR-3. LYVE-1+ (B) and VEGFR-3+ (C) lymphatic vessels were counted on the entire diaphragm sections and the numbers were normalized per total section area expressed in square millimeters. The results are presented as the mean vessel density per group ± SEM. (B) *P < .05 versus control as determined by Wilcoxon rank sum test. (C) **P < .01 versus control as determined by Student unpaired t test. The mean fluorescent intensity (MFI) per vessel was analyzed on LYVE-1+ (D) and VEGFR-3+ (E) lymphatic vessels (5-10 vessels per diaphragm). MFI is expressed as relative units normalized per vascular area expressed in square micrometers. The mean MFI values ± SEM derived from 3 mice per group are shown. (E) *P < .05 versus control, as determined by nested analysis of variance described in “Statistical analysis.” (F) Diaphragms from TG-treated and control mice were double-stained with anti-Prox1 and anti–VEGFR-3 antibodies. Arrows point to Prox1+ nuclei. (G) Prox1+ nuclei were enumerated and normalized per LYVE-1+ lymphatic area (μm2) in diaphragms of TG- and saline-treated control mice. **P < .01 versus control as determined by Student unpaired t test. (H) Diaphragm sections were costained with antibodies against VEGFR-3 or Prox1 and a proliferative marker, Ki-67, to assess proliferative status of lymphatic vessels in the diaphragms of TG-treated or control mice. Note overlapping expression of Ki-67/VEGFR-3 (arrow) and Ki-67/Prox1 (arrowhead) detected in inflamed lymphatic vessels but absent from quiescent lymphatic vessels in control tissues. Scale bars represent 100 μm (A) and 20 μm (F,H).

