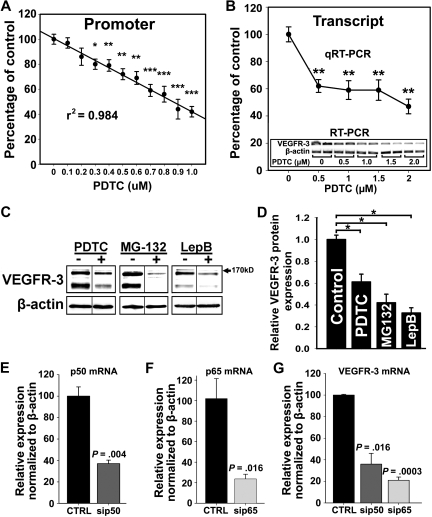
Figure 5.
NF-κB signaling is required for VEGFR-3 expression in lymphatic endothelial cells. (A) RLECs were transfected with the full-length VEGFR-3−849/+55 promoter and treated with PDTC (0-1μM) or vehicle for 18 hours. Promoter activity was measured by luciferase assay and normalized to total protein per well. Note linear inhibition of VEGFR-3 promoter activity by PDTC determined by linear regression (r2 shown on graph) of the mean promoter activity ± SEM of 3 independent experiments performed in duplicate (total n = 6 per condition). (B) VEGFR-3 transcript expression assayed by qRT-PCR in RLECs treated with PDTC (0-2μM) or vehicle. Data are presented as mean transcript expression normalized to β-actin of 3 independent experiments ± SEM (total n = 3 per condition). Inset shows a dose-dependent decrease of VEGFR-3 transcript detected by RT-PCR. (B-C) *P < .05 versus control, **P < .01 versus control, ***P < .001 versus control, by Student unpaired t test. (C) Western blot analysis of RLECs treated with PDTC (7.5μM), MG-132 (0.25μM), leptomycin B (10nM), or vehicle for 24 hours. β-Actin was used as a loading control. Vertical lines have been inserted to indicate repositioned gel lanes from blots presented in supplemental Figure 6, which show dose-dependent responses to NF-κB inhibitors. (D) Densitometric values demonstrate a statistically significant decrease in VEGFR-3 protein normalized to β-actin from RLECs treated with NF-κB inhibitors or vehicle for 24 hours. Experiments were performed in duplicate and data are presented as mean normalized per β-actin VEGFR-3 expression ± SEM; *P < .05 versus control, by Student unpaired t test. (E-G) H-LLY cells were transfected with p50- or p65-specific siRNA or scramble control siRNA for 48 hours and transcript expression for p50 (E), p65 (F), and VEGFR-3 (G) was determined by qRT-PCR. Data are presented as the mean transcript expression normalized to β-actin of 3 independent samples ± SEM (n = 3 per condition). Statistically significant differences were determined versus control, by Student unpaired t test. P values are displayed on the graphs.

