
Figure 3.
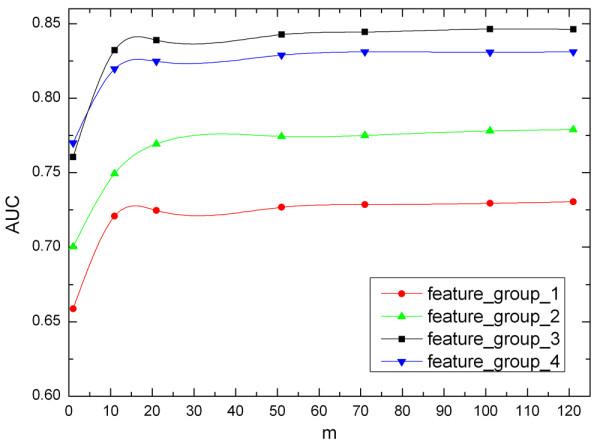
Performance vs. the value of m. The curves illustrate AUC scores obtained from Sub-EnClassifiers for four feature groups, with different values of m.
Official websites use .gov
A
.gov website belongs to an official
government organization in the United States.
Secure .gov websites use HTTPS
A lock (
) or https:// means you've safely
connected to the .gov website. Share sensitive
information only on official, secure websites.
Performance vs. the value of m. The curves illustrate AUC scores obtained from Sub-EnClassifiers for four feature groups, with different values of m.