
Figure 6.
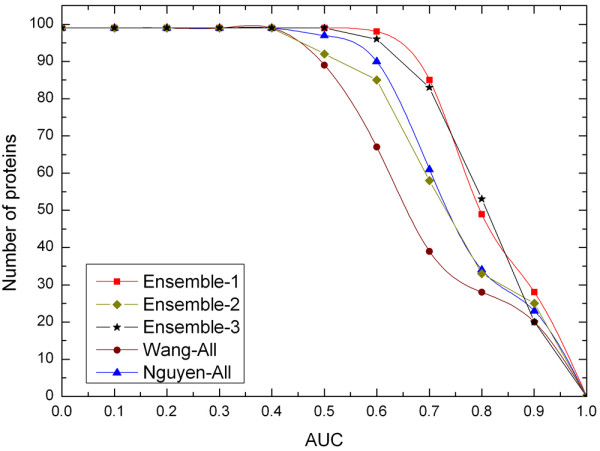
Performance comparison of our method with Wang's and Nguyen's. The graph plots the total number of proteins whose AUC scores are higher than specific threshold. Each curve corresponds to one prediction method.
Official websites use .gov
A
.gov website belongs to an official
government organization in the United States.
Secure .gov websites use HTTPS
A lock (
) or https:// means you've safely
connected to the .gov website. Share sensitive
information only on official, secure websites.
Performance comparison of our method with Wang's and Nguyen's. The graph plots the total number of proteins whose AUC scores are higher than specific threshold. Each curve corresponds to one prediction method.