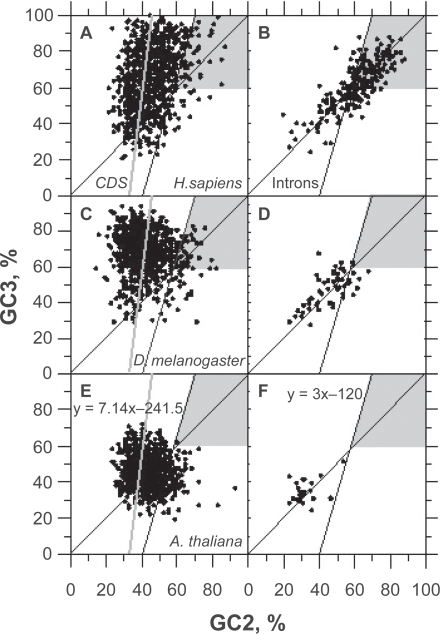
Figure 4.
Plots of GC3 vs. GC2 in true positives (CDS, panels: A,C,E) and false positives (introns, panels: B,D,F) ORFs ≥ 250 bp after classification by UFM without filters. The sequence samples of H. sapiens (A,B), D. melanogaster (C,D) and A. thaliana (E,F) are the same as those used for Figure 3 and Table 3. The gray areas match ORFs corresponding to GC2 levels larger than the quantity (GC3 + 120)/3 when GC > 60% that are filtered out by filter 1. The gray line that matches y = 7.14 × 241.5 is for the universal correlation.37 The black line y = 3 × 120 matches the left border of the gray zone.

