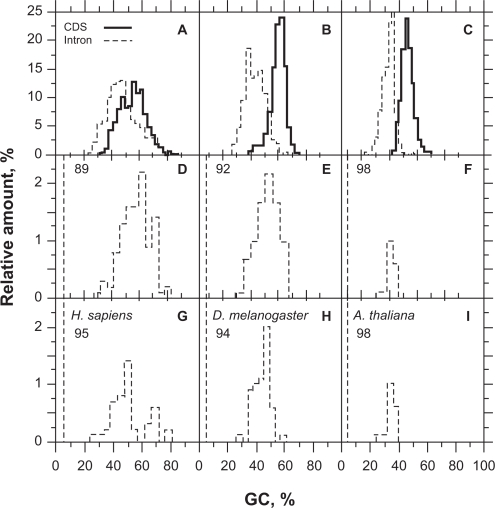
Figure 5,
Compositional properties of CDSs (bold) and introns (dashed) in H. sapiens (A,D,G), D. melanogaster (B,E,H) and A. thaliana (C,F,I). Panels A,B,C show the relative amount of sequences (%) from Figure 3 and Table 3 classified by GC level (%). Panels D,E,F show the distribution of false positives (intronic ORFs classified as coding) resulting from ORF (≥250 bp) classification by filters 1 + 3. Panels G,H,I show the distribution of false positives (intronic ORFs classified as coding) resulting from ORF (≥250 bp) classification by filters 2 + 3. The numbers on the panels’ upper left indicate the proportion of intron sequences (%) that did not have any ORF with the purine bias of coding sequences for the size threshold considered.

