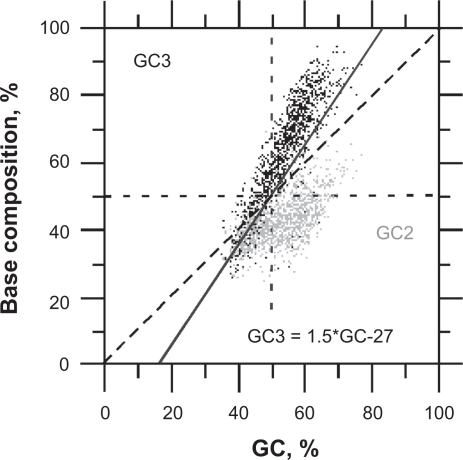
Figure 6.
Relationship of GC2 (gray, y axis) and GC3 (black, y axis) vs. GC (x axis) in human CDSs (>600 bp). The solid line (GC3 = 1.5*GC-27) indicates the threshold of false positive filtering. This threshold has the same rate of false positive and true positive filtering as the threshold GC3 = 3*GC2–120 (Fig. 4). False positives of coding ORFs would stand on the diagonal of this plot (GC2≈GC3).

