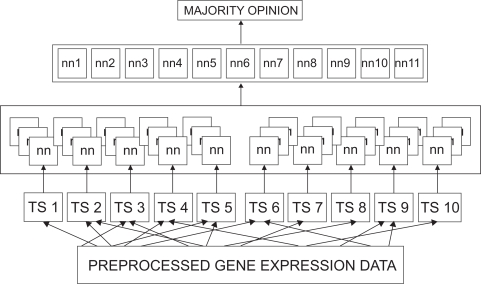
Figure 1.
Architectural diagram of the Committee Neural Network System: The 250 gene expression data was divided into ten sets of 25 each. Several neural networks were trained using each of these sets. Each network has three output nodes corresponding to each classification (T-ALL, B-ALL, and AML). The best performing 11 networks were recruited into a committee. The committee decision was by majority opinion.

