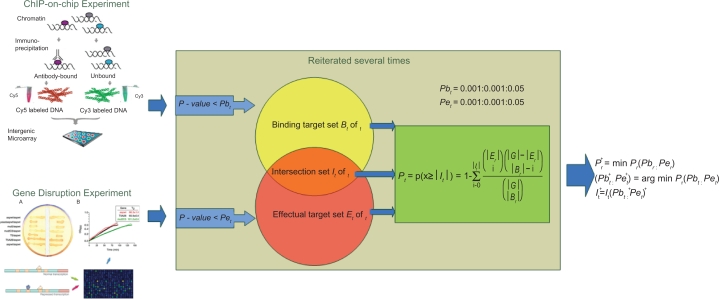
Figure 1.
Schematic diagram of the method. The starting point for this method depends on ChIP binding data and TF knockout data (the data sources showed on the left). For each TF, two thresholds are selected for the ChIP binding data and TF deletion data, respectively. When the binding P value of a single gene is less than the binding threshold, this gene is considered to be the binding target. Similarly, if the effectual P value of a single gene in a deletion experiment is less than its assigned threshold, then this gene is defined as the affected target. Both of the two thresholds are set in the range from 0.001 to 0.05 with an increment of 0.001. A value called overlapping significance is calculated based on the binding target set, the affected target set and the intersection of them (the intersecting ovals in the middle). This process is reiterated for all possible combinations of thresholds so that the maximal overlapping significance is obtained (procedures and formulas are showed on the right).

