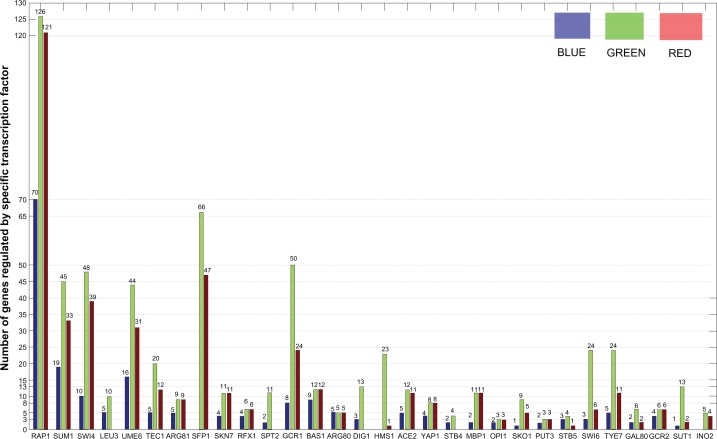
Figure 2.
Comparison with YEASTARCT. For the 30 TFs, number of the target genes identified with the stringent P-value threshold pair (Pbt = 0.001, Pet = 0.001) (blue), number of the target genes inferred with the optimal threshold pair (Pb*t, Pe*t) by our method (green), and the number of our predictions supported in YEASTARCT are shown (red).

