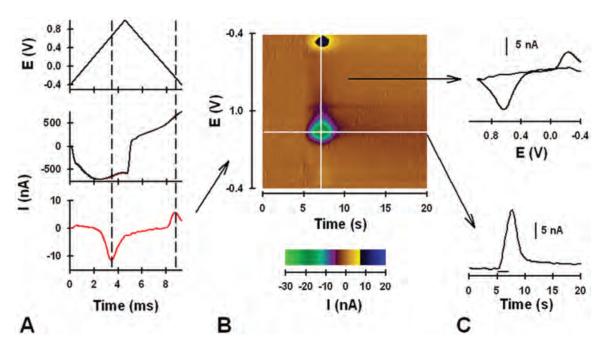
Fig. 2.
Graphs and pseudocolor plot showing results of FSCV. A: Applied triangle waveform (upper panel); background current with (red line) and without (black line) dopamine (center panel; note that the black line overlaps the red line); background-subtracted current (lower panel). B: Pseudocolor plot. C: Background-subtracted cyclic voltammogram (upper panel) and current measured at the peak oxidative potential for dopamine and plotted with time (lower panel).

