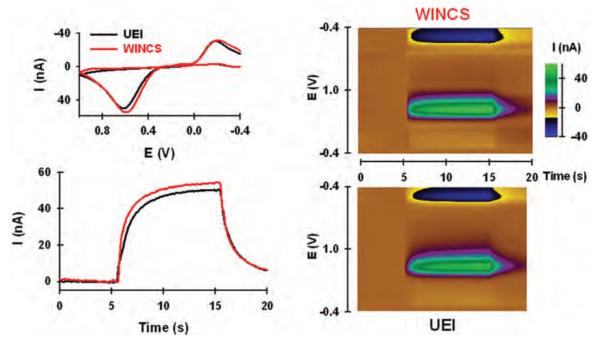
Fig. 3.
Comparison of the WINCS and UEI by using flow injection analysis. Left: Background-subtracted voltammograms for dopamine recorded by WINCS and UEI (upper panel) and current measured at the peak oxidative potential for dopamine, plotted with time and measured by the WINCS and UEI (lower panel). Right: Pseudocolor plots for dopamine determined by testing with the WINCS (upper panel) and the UEI (lower panel).

