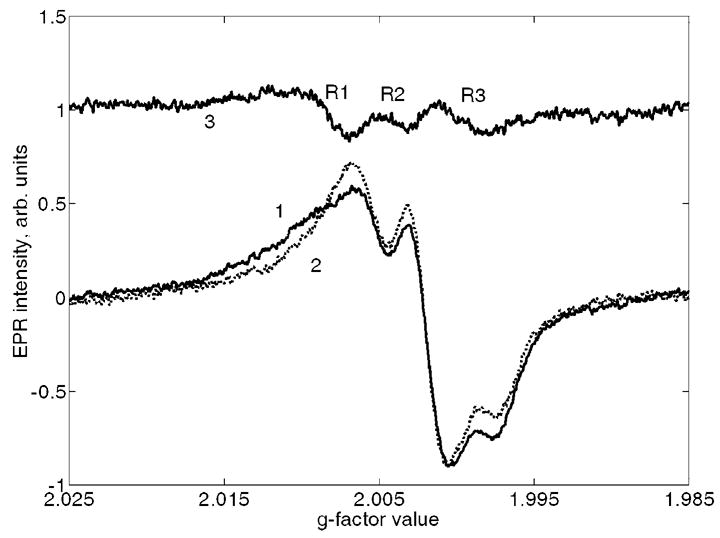
Figure 3.

Least-squares fitting of the EPR spectra for UV-exposed samples: 1 is an initial spectrum; 2 is the best fit using the reference standards for dosimetric and native signals and 3 is the difference between 1 and 2. R1, R2 and R3 are UV-specific lines with approximate g-factors of 2.0095 (low field peak at 2.0110), 2.005 and 2.0005 respectively.
