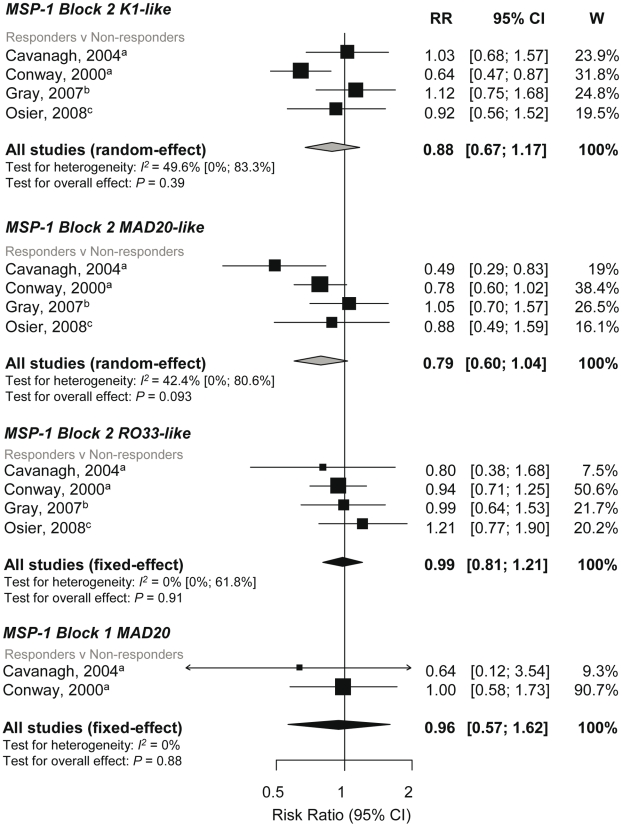
Figure 3. Forest plot of the association of MSP-1 block 2 and block 1 responses with incidence of symptomatic P. falciparum malaria.
RRs represent the risk of symptomatic P. falciparum malaria in IgG responders relative to nonresponders. RR<1 indicate that responders are protected from symptomatic P. falciparum whereas RR>1 indicate susceptibility. aEstimates are published estimates; bestimates are calculated by authors from data in the paper; cdata supplied by original authors and calculated by current authors. All reported estimates are unadjusted. W, weight.

