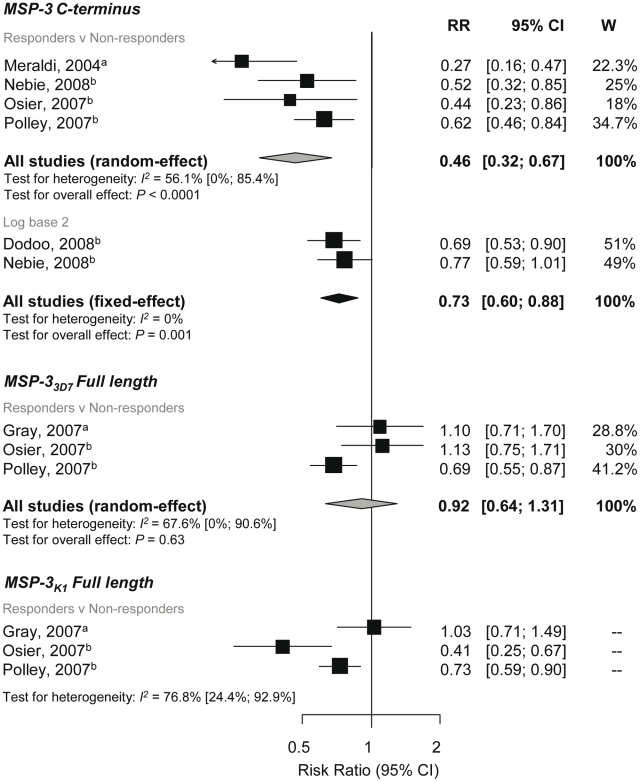
Figure 6. Forest plot of the association of MSP-3 responses with incidence of symptomatic P. falciparum malaria.
RR<1 indicate protection from symptomatic P. falciparum whereas RR>1 indicate susceptibility in responders versus nonresponders or per doubling of antibody responses. Estimates reported are unadjusted with the exception of Nebie (2008) (adjusted for age, sex, and village) [30] and Nebie (2008) and Dodoo (2008) (adjusted for age) [29],[44]. aEstimates are calculated by authors from data in the paper; bestimates are published estimates. All reported estimates are unadjusted. W, weight.

