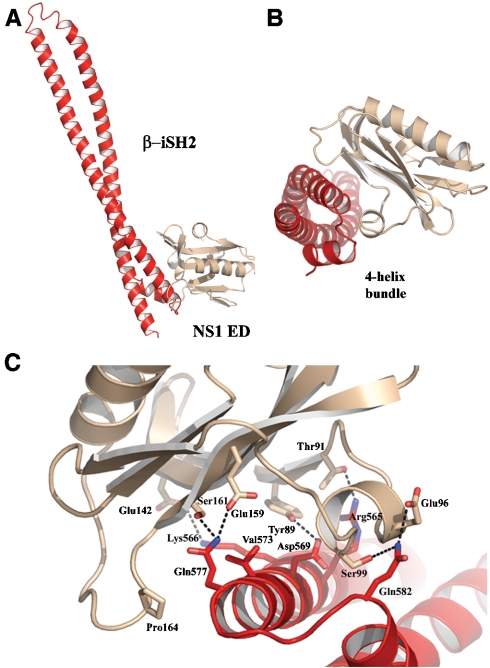
Fig. 2.
Structure of the ED:β-iSH2 complex. (A) Cartoon representation of the ED:β-iSH2 complex. (B) Cartoon representation of the four-helix bundle formed at the complex interface. (C) Residues at the ED:β-iSH2 interface. Potential hydrogen bonds are highlighted. Individual residues are shown in stick representation. NS1 ED is colored gold, and β-iSH2 is colored red.

